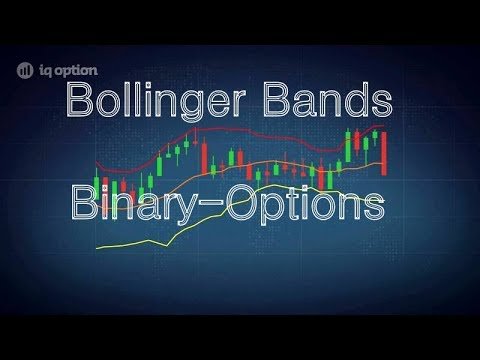
Bollinger Bands Indicator – Binary Options Trading Pattern

RISK WARNING: YOUR CAPITAL MIGHT BE AT RISK
NOTE: THIS VIDEO IS NOT INVESTMENT ADVICE.
“General Risk Warning: The financial products offered by the company carry a high
level of risk and can result in the loss of all your funds. You should never invest
money that you cannot afford to lose.”
—————————————-
Benefits of Bollinger Bands
Use them to trade trends
Identify early reversal signals
Exhibit how strong (tradeable a stock’s move is
Reveal a great way to trade break outs
General Uses/Indications from the Bands
When the stock price touches the upper Bollinger Band continually, the price is thought to be overbought.
when stock prices continually touch the lower band of the Bollinger Band, the prices are considered “oversold,” and thusly a buy signal would kick in.
Designate the upper and lower bands as price targets when using Bollinger Bands. If the price deflects off of the lower band and crosses above the middle line (the 20-day average), then the upper band comes to represent the upper price target. Prices usually fluctuate between the upper band and the 20-day moving average in a strong uptrend. When this happens, a crossing below the middle line warns of a reversal in trends to the downside (lower band).
Trending stocks will Walk the Bands Stocks touching the upperband are in and uptrend. Stock touching the lowerband are in a downtrend. Channeling stocks will not touch the bands.
General Trading Rules
Use of the Bollinger Band among traders varies wildly. Some traders buy when the price touches the lower Bollinger Band and sell when price touches the moving average in the center of the bands. Conversely, other traders buy when price breaks above the upper Bollinger Band or sell when price falls beneath the lower Bollinger Band.
Bollinger Bands can also be used in combination with price action and other indicators to generate signals and foreshadow significant moves. A “double bottom buy” signal is given when prices penetrate the lower band and remain above the lower band after a subsequent low forms. It doesn’t matter which low is higher or lower than the other one, as long as the second low stays above the lower band. On the other hand, a “double top sell” signal is given when the prices peak above the upper band and the next peak fails to break above the upper band.
Not only stock traders use the Bollinger Band. Options traders (especially implied volatility traders) often sell options when Bollinger Bands are at their most historic difference or buy when Bollinger Bands are at their closest historic point. They do this with the expectation that volatility will revert back toward the average historical volatility level for the stock.
In conclusion, Bollinger Bands are helpful when generating buy and sell signals. They are not, however, designed to determine the future direction of a security. The Bands were designed to add to other analysis techniques and indicators. All in all, Bollinger Bands serve two primary functions: the identification of low and high volatility periods, and the detection of periods when prices are at an extreme and possibly unsustainable level.
Article Source: http://EzineArticles.com/1198192
—————————————–
Join Iq Option: http://affiliate.iqoption.com/redir/?aff=62882
FB Page: https://www.facebook.com/binaryoptionsblackeagle/
———————————————————-
Vanze & Reunify – Angel (feat. Parker Polhill & Bibiane Z) [NCS Release]
[Connect with NCS]
• http://soundcloud.com/nocopyrightsounds
• http://instagram.com/nocopyrightsounds
• http://facebook.com/NoCopyrightSounds
• http://twitch.tv/nocopyrightsounds
• http://twitter.com/NCSounds
• http://spoti.fi/NCS
NCM Epic Music Ender Guney
https://www.youtube.com/channel/UCHEioEoqyFPsOiW8CepDaYg
source