RSI INDICATOR #RSI #quotex

What are RSI?
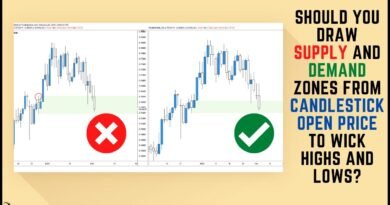
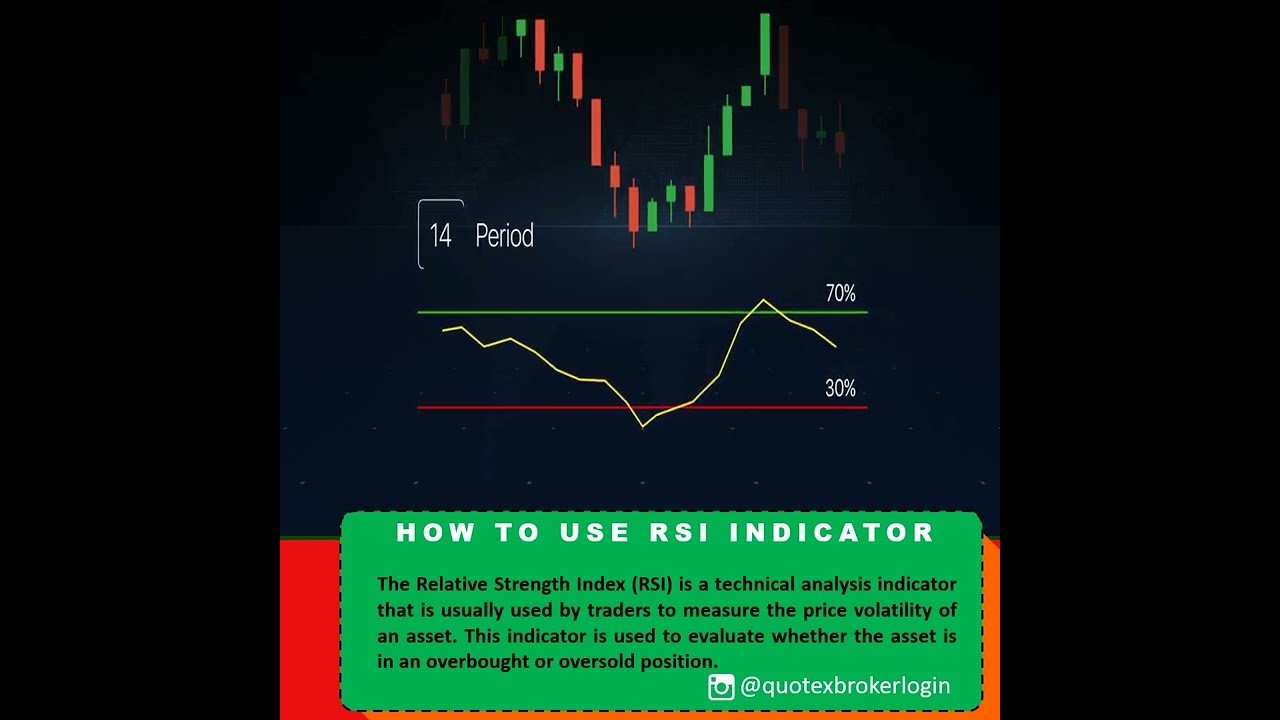
The RSI indicator is a technical analysis tool that measures the speed and momentum of recent price changes to gauge whether an asset’s price is oversold or overbought. The RSI itself stands for “Relative Strength Index”. RSI appears in the form of a line chart (oscillator) with a scale of zero (0) to (100) in the subwindow below the asset price chart.
How Do RSIs Work?
The way the RSI works is that it can be divided into two, namely as a tool for detecting overbought/oversold and divergence. The following is a complete description.
Overbought occurs when the RSI line rises above the 70 threshold. In this situation, traders assume the asset price is already too expensive so that there is potential for it to move down next. A sell signal appears after the RSI line drops across the 70 threshold in a downward direction.
Oversold occurs when the RSI line drops to the threshold of 30 or even lower. In this situation, the trader assumes that the asset price is already cheap so that it will move up next. A buy signal appears after the RSI line rises across the 30 threshold in an upward direction.
Divergence occurs when the RSI line forms a low/high point that is opposite the low/high point formed on the asset price chart. Situations like this often indicate a trend reversal of price movements towards the direction indicated by the RSI.
Why is RSI Helpful?
We can conclude some of the benefits of RSI based on the description above, including:
Assists traders in predicting asset price movements.
Helping traders to confirm trend continuation or reversal (trend reversals & continuation).
Helps traders find out whether an asset is oversold, overbought, or in a neutral position.
Provides short term buy/sell signals for traders
The best application of the RSI indicator for trend-following trading strategies. For example, to buy stocks when there is a pullback in a bullish trend. RSI can also detect trend changes (reversals) through divergence, but the accuracy is poor and requires confirmation from other indicators.
RSI limitations
The RSI indicator is most suitable for use in oscillating market conditions, namely situations where price pressures are balanced alternately between bullish and bearish. Conversely, the RSI indicator is less precise in conditions of a very strong price trend in one direction only (up or down).
When the price trend is very bullish, the RSI line can stay in the overbought area for a very long time. Likewise, when the price trend is very bearish, the RSI line can inhabit the oversold area for months without ever rising above the 30 threshold.
To overcome this drawback, traders can combine RSI with other indicators to create a reliable trading strategy. Several popular trading strategies pair the RSI indicator with MACD or Bollinger Bands.
Alternative link trading binary options :
quotex – https://quotexbrokerlogin.com
www.qxbroker.xyz
youtube : https://www.youtube.com/@quotexbrokerlogin
#iqoption #iqoptionstrategy #iqoptionstrading #iq #broker #forex #binary #binaryoptions #binarytrading #binomo #quotex #olymptrade
source