Lesson 3 best support and resistance series what is a stop hunt Forex Binary options

You can join my facebook group : https://facebook.com/groups/Teachmehowtotrade/ If you need a forex broker, after having testing a lot the one i recommend is ICMarket : https://tinyurl.com/ICMarketECN or you can also contact me if you have any questions : http://m.me/TMHTTDL Join my Telegram free channel for free signals : https://t.me/joinchat/AAAAAEkUuUBzzqUfXZ3f9A here is also my mentorship program on 5 months : https://tinyurl.com/Mentorshipplussignals
#forex trading #forex strategy #forex millionaire #forex for beginners #forex introduction #forex lifestyle
#support and resistance
Concept of Stop Hunt:
A stop hune induces the crowd to think that the trend will continue immediately after touching or slightly breaking a level of Snr, how do they do it?
They push the price aggressively with big candles most of the times in 3 pushes to the level of Snr so the crowd think the price is powerful enough to break it, and that’s what price action texts books tell us, then they reject the level most of the time crossing the 13 EMA to take out the SL of early breakout traders, then they come back to the level, overcome it or not but anyway open the spread to take as much money as they can then they reverse and shift the price in a big reversal move, this whole move forms generaly some kind of M or W pattern wich is the clue they give us when we want to know if a market is likely to reverse. For your entertainment put a spread indicator on your chart and watch the value increase when price makes a kind of M or W formation you will see it live
To come back to to the best position of our SnR level, if the big boys usualy make a SH at a certain level and reverse the price several times exactly at the same price, we can count on a strong probability they ll do it again, and this exact point is the end of the spike and its better when the spikes end up at the same level with different attempts
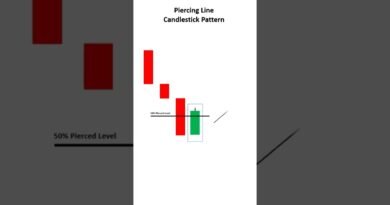
When we find a level reversed 2 times at minimum we can use a line chart at first to spot significant turning points or/and we can use a candlestick chart to get a more precise level and we have to chose between 3 places where to put our levels:
End of the wick of 1 single attempt
End of the body 1 attempt or average of several attemps
Average of the wicks on several attemps, more regular is the level better it is
In a clear order of strength:
Average of the wicks when the wicks are from good shaped Pin Bar and the extreme are nearly at the same price level
Extreme single pin bar wick
Bodies level and if there is several big body candles rejecting the level stronger it is
The last attempt of the level has also more significance to the actual retouch so depending on the last touch of the level you might adjust a little your level
Wicks works best because it shows until where the previous stop hunts has been made in other words, where exactly the big money reversed the market the previous times
A Stop hunt is a market inducement realized by the big players to induce the crowd in the wrong direction, it has often the shape of a M or a W candlestick pattern
It occurs from the 15M chart and above that in all time frames
If a level of support and resistance is well plotted it should have around 70% chances of reversal but we must be aware of the Stop hunt practice and be ready to react for it if forms
source