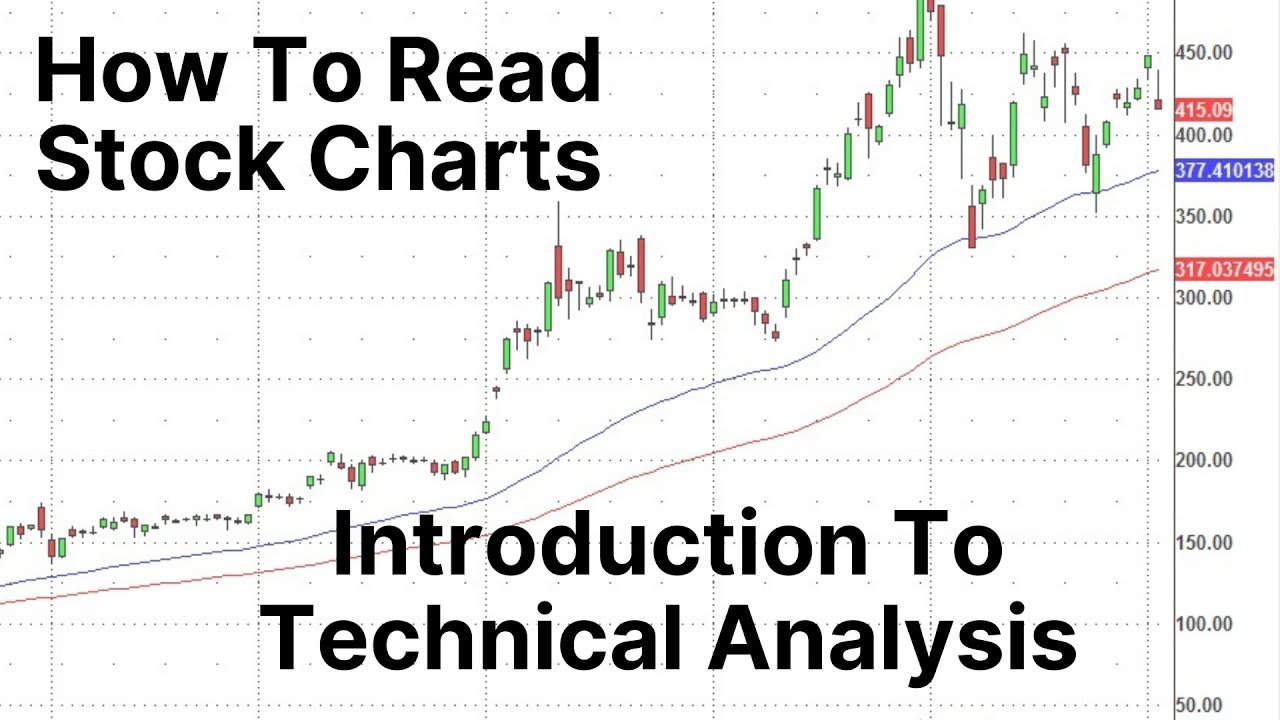
Introduction To Technical Analysis – Stock Chart Reading For Beginners

If you’re going to trade options contracts, you need to know how to read the stock charts first.
Technical analysis is the term used to analyze stocks based on the patterns they make on the charts.
You can gain a real advantage and turbo charge your trading results by learning some basic chart set-ups.
In the video, I present a basic introduction on how to look at the charts and spot certain patterns that repeat over and over again. We will look at trend lines, moving averages, support & resistance, and popular patterns.
Also in the video, I analyze the stock charts as part of my “Saturday Synopsis”, to comment on last week’s trading activity and what may lay ahead for next week.
Send us any questions you have, or leave a comment if you wish.
Website: https://www.smartoptionseller.com/
Contact us: https://www.smartoptionseller.com/contact
Free e-book: https://www.smartoptionseller.com/put-selling-basics
Services: https://www.smartoptionseller.com/services
Twitter: https://twitter.com/smartoptseller
Facebook: https://www.facebook.com/smartoptionseller
DISCLAIMER: This video is for educational purposes only and should not be construed as financial advice or a recommendation to buy or sell any security or investment. Consult with a professional financial advisor before making any investment decisions.
source