Crypto Trading: 4 Hour & 1 Hour Chart Trendline Strategy

A 4-hour & 1-hour trendline strategy in crypto trading is a simple way to combine higher-timeframe direction with lower-timeframe precision. It’s commonly used in technical analysis to avoid random entries and trade with structure.
The idea is straightforward:
You use the 4-hour chart to understand the main trend, and the 1-hour chart to time your entries.
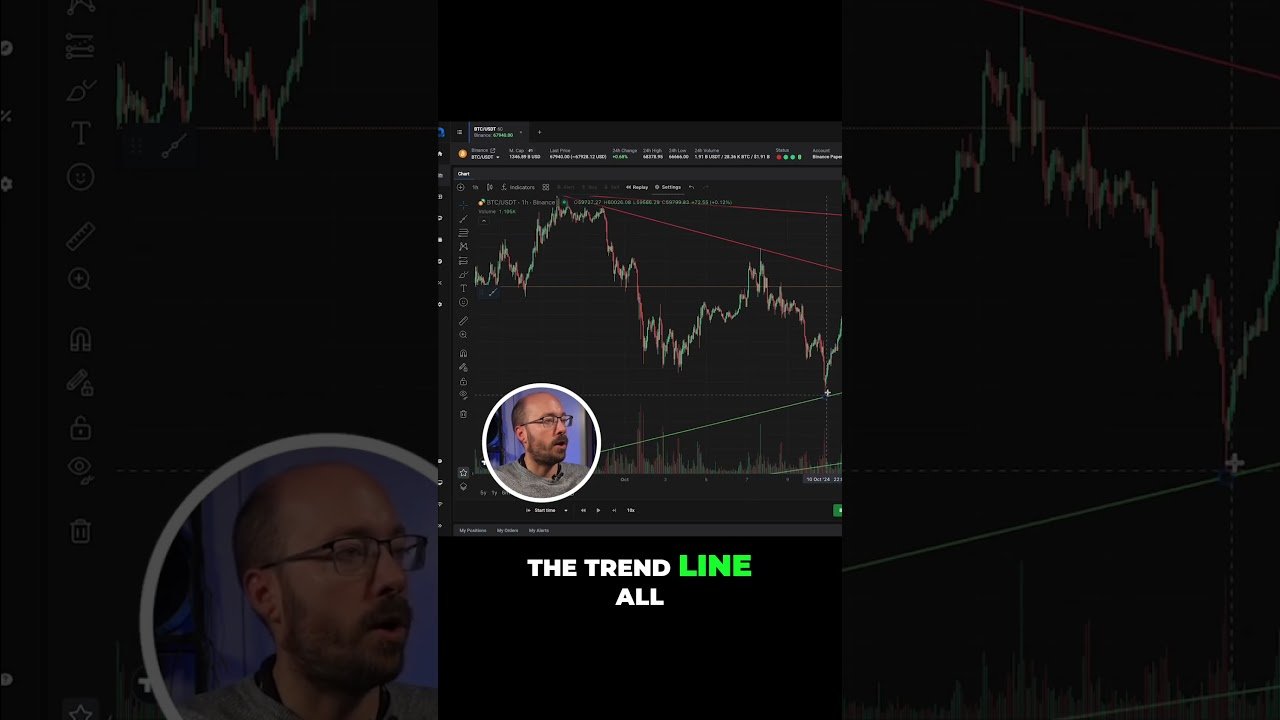
On the 4-hour chart, you draw your main trend line by connecting key highs (for a downtrend) or lows (for an uptrend). This gives you the bigger picture—whether the market is generally going up, down, or moving sideways. You’re not trading here yet, just identifying direction and important levels.
Then you switch to the 1-hour chart. Here, you draw smaller trend lines within the bigger structure. This is where you look for setups.
For example, if the 4-hour trend is downward, you wait for price on the 1-hour chart to form a temporary upward move (a pullback). You draw a small upward trend line on that pullback. When price breaks below that smaller trend line, it signals that the pullback may be ending—and the larger downtrend could continue. That’s where traders look for short entries.
If the 4-hour trend is upward, the logic is reversed. You wait for a pullback on the 1-hour chart, draw a downward trend line, and enter when price breaks above it.
source