Binary Options best support and resistance follow trend strategy

contact me on telegramhttps://linktr.ee/Tmhtt
https://t.me/DamienTmhtt
My BO recommended broker: https://tinyurl.com/IQOptionTMHTT
Follow this link to download the indicators: https://drive.google.com/open?id=1loKRIcjqHQ1nAQ2cgDCdHJ4JvjuX8YSJ
Hi everyone today I’ll explain to you my most powerfull system or strategy for BO
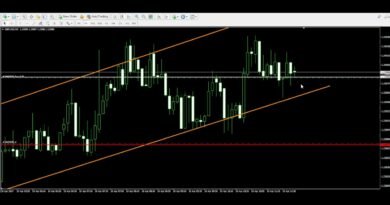
This system uses strong levels of Support and resistance to enter pull back reversal trades on 1 candle expiration, it can work on any tf but gets more reliable from the 15m chart but 5M chart works fine too I wouldn’t trade the 1M
1st lets see on a real chart how you spot the actual trend on the 5M chart but before lets draw a trend to remind us how it is for example higher highs higher lows = uptrend lower high and lower low = downtrend lets see on the 5m chart now
Higher highs higers low etc….
Also note that you will take the 1st and second attempt of a level only never more and you will take the second attempt only if the first shows a strong rejection like a pin bar etc.
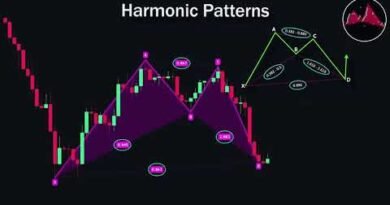
Impulsive vs corrective move explanation also drawing and on chart mesure of the move to see who is stronger
Now lets see the indicators and their purpose.
I plot the 200ema because that’s the most powerfull of all used by the institutions and also it will help a bit with the trend even if the PA if the primer way to define your actual trend
On the system we will use an indicator to help us with the trend and avoid too strong momentum or power against us this indicator is pzswing trading this indicator shows where it is safe to take a trade it can be above or below the price if above we search for put if below we search for call
The second indicator is a currency symbol changer it will permit you to switch easely from 1 pair to the other and go in the setting and writte only the pairs you want to trade it’s a useful tool to be faster
The 3rd indicator is Affcal it will display from forex factory economic calendar when will be the next impacting news
The next is the Volume at price or level sensor it take the amount of time the candles has spent at a specific price the drops are telling us the strong Support and resistance on the chart based on this analysis also the extreme spike can be used but they are less effective
Method if you trade the 5m or 15m chart I would recommend you use first the 1H chart to spot the good SnR then you move into your trading tf
You can fine tune the entry using a TMA slope and Bollinger band on lower time frame this step can help but is not fundamental
Combining a tma slope and a BB is also a very powerfull tool to see overbought znd oversold zones so if the price is outside of both it is likely going to come back inside, if you add to that that you trade a pull back wich is a quite weak move compared to the impulsive move
Also note that you will take the 1st and second attempt of a level only never more and you will take the second attempt only if the first shows a strong rejection like a pin bar etc.
Combining all together, you plot your levels first from the 1 hour then you look down the 5M or 15M chart and you plot your lower tf levels don’t plot too much just the most obvious one a strong valley is very good sign lets check the good and bad levels together
After personnaly I set 2 alerts on my mt4 above and below the levels since we take only breakout trades
Once a level is broken significantly I move my alert to the level that now is valid to take , you will need then to be according to the the pzswing trading cloud and not exceed it if price exceed it it means the momentum is against us now
Also if you use the BB and TMA confirmation you can zoom on the lower tf and see if the price is outside the BB and the TMA for more safety
source