Stock Market Outlook: Why This Pullback May Already Be Over

When the U.S. launched “Operation Epic Fury” – a high-intensity air campaign intended “to dismantle the Iranian regime’s security apparatus,” per U.S. Central Command – markets reacted instantly.
Oil surged. Volatility spiked. The S&P 500 broke below its 200-day moving average.
The narrative quickly followed: escalation risk, retaliation scenarios, the potential for a much broader conflict.
For a moment, it looked like the market was pricing in something much bigger than a single military operation.
But markets trade on outcomes, not headlines. And within days, the story started to shift.
Reports suggested back-channel communication had begun. Back-channel became front-channel. The geopolitical temperature dropped from ‘thermonuclear’ to ‘tense but manageable.’ Oil started to give back its war premium.
And the S&P 500, after spending exactly two trading days below its 200-day moving average, retook the line on March 23 as if the market was beginning to price this as a contained event rather than an escalating conflict.
That kind of movement is what happens when a worst-case narrative starts getting repriced in real time. And there’s a clear playbook for how these moments tend to unfold.
The Market Is Following a Familiar Playbook
If you were in the markets back in April 2025, then this script will feel familiar.
That’s when President Trump’s “Liberation Day” tariffs sent markets into freefall – sending the S&P 500 down nearly 5% in two days and pushing the market toward a 10% correction within a week.
But that move didn’t stick.
The pause that came 90 days later was due to what financial analysts have dubbed TACO: Trump Always Chickens Out – a pattern where aggressive policy threats are used to force concessions, but ultimately get dialed back before causing lasting economic damage.
Markets, which had spent weeks pricing in a full-blown trade war, suddenly had to reprice an entirely different world. The S&P 500 ripped higher. AI stocks went parabolic. It was one of the fastest relief rallies in recent memory.
That sequence – sharp drawdown, policy reversal, violent relief rally – created a recognizable rhythm for investors.
The Iran situation is following the same playbook – at least so far.
The strike appears to have been designed to produce leverage rather than prolonged conflict. Maximum pressure. Maximum optics. Maximum negotiating leverage. Iran, despite its rhetoric, faces strong economic and strategic incentives to avoid prolonged escalation – including strained domestic conditions, limited export flexibility, and the risk of overwhelming military response.
That suggests the TACO logic applies here too: when the cost of not blinking exceeds the cost of blinking, you blink. If that logic holds, Iran may ultimately choose de-escalation over escalation.
What De-Escalation Would Mean for Markets
If de-escalation continues – and early signals suggest that may be the direction – a plausible path forward looks like this: oil could retreat to the $65 to $70 range, the inflation pulse from the war premium would likely wash through the data within two to three months, and the Federal Reserve may find itself with the window it has been waiting for.
Rate cuts resume. The economy exhales. And stocks – particularly the AI infrastructure complex that got caught in the geopolitical crossfire – move higher.
In prior TACO-style episodes, once the overhang lifts, capital tends to flow back into leadership. And right now, leadership has already been reset.
Big Tech has gone through a sentiment washout and valuation compression, even as its earnings outlook hasn’t materially changed.
That combination is rare – and we’ll break it down in our next issue.
This is where the weight of the evidence points right now.
Of course, that path depends on continued de-escalation – something that remains fluid and far from guaranteed. But based on current signals, we believe this is the most likely outcome here.
Now let’s look at what the charts are telling us.
A Key S&P 500 Signal Just Turned Bullish
The technical picture just gave us a constructive signal – with an important condition attached.
We reviewed every trading day in the S&P 500 since 1950 and identified 91 instances of the following setup: the index briefly dips below its 200-day moving average (no more than five trading days), retakes the line, and does so while the 200-day slope remains positive.
This is a precise signal – it filters out the genuine bear markets, where the 200-day starts rolling over and the dips below it become extended breakdowns. What’s left are periods where the market had a brief breakdown – and then resumed its prior trend.
The aggregate forward returns are bullish. After all 91 occurrences, the S&P 500 averaged +3.5% over the next three months, +5.0% over six months, and +8.3% over 12 months – with a 72.5% win rate at three months. Solid, but not spectacular.
But when we segmented the data further, the results split dramatically. In 30 of those 91 cases – about one-third of the time – the S&P 500 retook its 200-day and simply kept going, staying above the line for the next 15 consecutive trading sessions. We called these the V-Shape events. The other 60 cases involved the market retaking the 200-day but then battling with it – falling back below within 15 sessions, churning around, testing investors’ patience. We called these the Choppy events.
The performance difference between the two groups is not subtle.
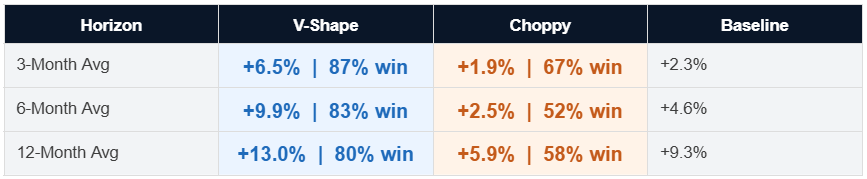
V-Shape events produced an average three-month return of +6.5% with an 87% win rate. Six months out, the average return was +9.9%. Twelve months: +13.0%. These are some of the cleanest forward return profiles in the historical record – better than the all-period baseline at every horizon, by a meaningful margin.
The Choppy events resulted in +1.9% on average at three months, with a six-month win rate of just 52%. That’s a coin flip. This group is where the early-stage breakdowns lived — the 2000 distribution top, the 2007–2008 rollover. Strong slopes masked deteriorating internals, and the 200-day kept getting tested until it finally gave way.
The distinction is everything. And the classification window is the next 15 trading sessions, from today through roughly April 15, 2026.
The Path Forward for Stocks From Here
So now we have two signals – one from the macro, one from the market.
Here is the synthesis.
The fundamental case suggests a path where Iran ultimately de-escalates, oil falls, inflation cools, the Fed cuts, and the AI bull market resumes from where it left off before Operation Epic Fury interrupted it. The technical case says the 200-day retake is historically a powerful signal – but its power is almost entirely concentrated in the V-Shape outcome, which requires the market to hold this line over the next few weeks.
If that path plays out, the market holds above the 200-day. A deal gets done, the relief rally kicks in, and the S&P 500 spends the next two to three weeks building a base above the 200-day. That’s the V-Shape scenario. And history shows that if that’s how things shake out, the next 12 months could look very good indeed.
The parallel to April 2025 is not just rhetorical. That TACO moment gave us a 20%-plus rally in AI infrastructure names over the subsequent six months. The setup here – lifting geopolitical overhang, a reengaged Fed, intact hyperscaler capex spending, accelerating AI adoption – is, in some ways, even cleaner (though still dependent on geopolitical follow-through).
The data leans bullish. The macro suggests the overhang is lifting. And the playbook says we’ve seen this before.
But stepping back, this isn’t just about one geopolitical event or one technical signal.
It’s about understanding how markets behave in this new environment: one where policy, positioning, and capital flows are driving outcomes faster than traditional fundamentals alone.
The playbook that worked for the past decade is changing – and the investors who recognize that early are the ones who tend to capture the biggest opportunities.
We’ve outlined those new rules – and how we’re positioning around them – right here.